Moving Beyond Dashboards to Anomaly Detection for A Comprehensive View of Business Analytics

Imagine you're running an online store that sells handmade crafts. One day, without any warning, orders for a specific item suddenly skyrocket. Maybe a popular social media influencer mentioned this product, or perhaps there is an error on the pricing page. How long does it take you to find out this change in demand and determine the causes behind it?
The answer really depends on how you use your data. There are two key aspects to using your data to determine the root cause:
At what frequency do you really look at the data?
How soon is the data available for you to look at it?
In this blog, I am focusing on the consumption frequency, the challenges of monitoring the data continuously, and the impact of not being able to do sophisticated statistical inferencing. In a separate blog, I will discuss the need to build a real-time data pipeline to ensure that the lag between event and anomaly detection is minimal. For now, let’s focus on how data gets used in most enterprises today and why it needs to change.
The old way: Monitoring business metrics with dashboards
For years, dashboards have been the go-to tool for businesses to keep track of their performance. They're an analogy to the control panel in a car, showing you your speed, fuel level, and whether anything needs immediate attention. In a business context, they might show top-level sales figures, website traffic, or customer engagement metrics. It's a way for business analysts (the people in charge of understanding this data) to keep an eye on things and make sure the company is heading in the right direction.
But here's the catch: many dashboards are driven by periodic data updates. It would be like checking the control panel only every few hours during the ride. Do you really drive your car and not look at the control panel for several hours at a time? Would you only check your gas gauge once your vehicle is sputtering and the engine quit?
In the business context, this method can miss sudden changes or problems because your analysts can’t afford to only look at dashboards all the time. Plus, even if they did, these top-level dashboards don’t get deep down into the data dimensions to tell you what is really going on. For instance, if your engine service light comes on, that doesn’t diagnose what is wrong with your car.
Are dashboards dead?

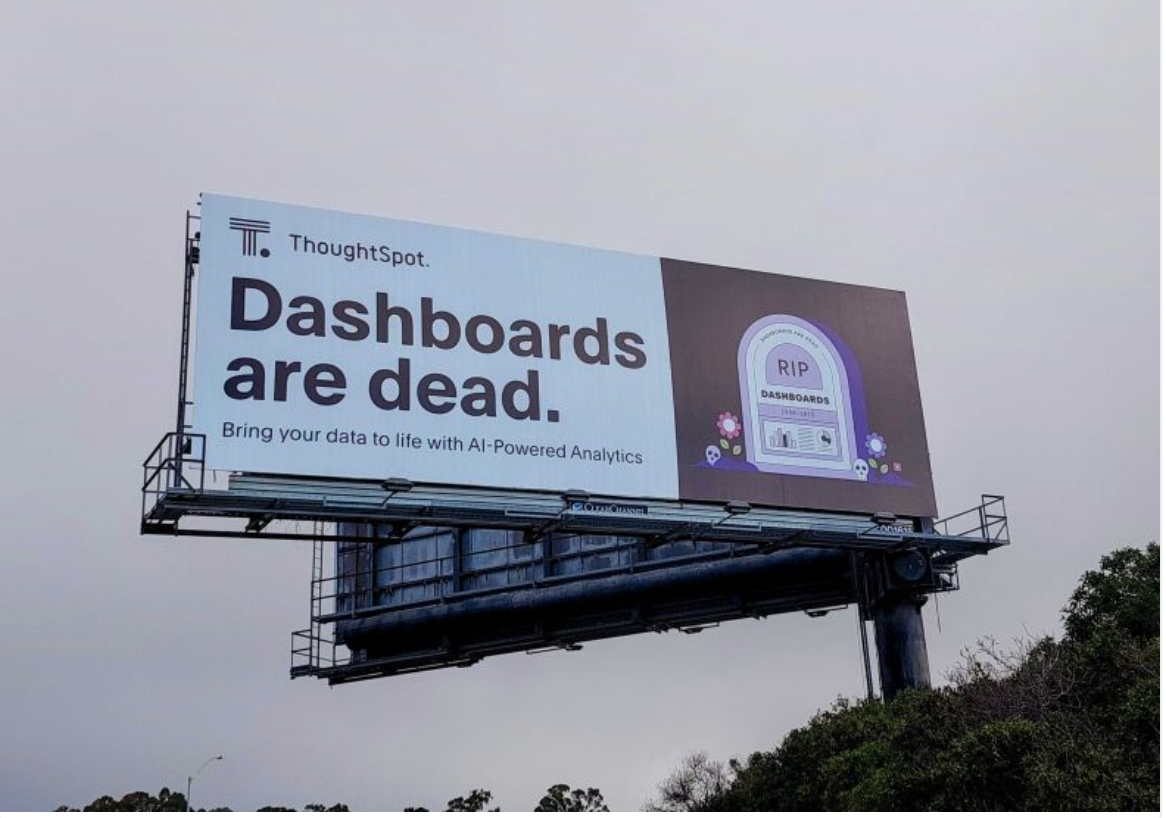
This is one of the most interesting billboards I’ve seen put up on 101 in the San Francisco Bay Area. If this was put up today when marketing is reimagining everything to add AI to the name or the tagline of an offering, it wouldn’t be memorable. This messaging was memorable because ThoughtSpot did it back in 2019. What ThoughtSpot really meant was that everyone else’s dashboard is dead and their AI-Powered Analytics were essentially a dashboard with better interactivity compared to existing solutions back then.
But does that really solve the problem that I started this blog with? Someone will still need to go to a dashboard to see a trendline indicating whether something is not right — in a positive or negative way.
The new way: Anomaly detection
Now, imagine a system that's always watching, always analyzing, and can instantly notice when something unusual happens. This is what anomaly detection applications do. They continuously monitor data as it comes in, looking for anything that doesn't fit the pattern. It's like equipping your vehicle with an advanced navigation system that not only guides you through the fastest routes but also vigilantly monitors for any signs of trouble — from potential collisions to running low on fuel — ensuring you're always informed and ready to make swift decisions on the road.
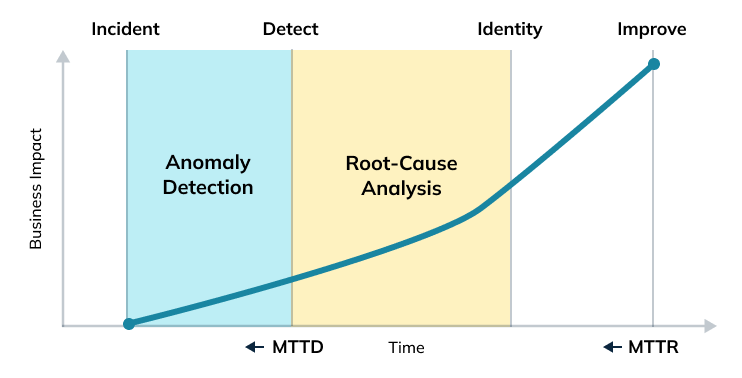
When an anomaly detection application finds something odd, it doesn't just make a note of it. It sends an alert to the right person who can fix the issue, and helps them perform root cause analysis (RCA). This approach is much faster and more efficient than waiting for someone to check the dashboard and maybe spot the problem. Anomaly detection is a game-changer because it allows businesses to react instantly to any unexpected changes, from a sudden drop in website traffic to a spike in sales for a particular product.
How is anomaly detection different from alerting?
For folks unfamiliar with anomaly detection, it may seem comparable to an alerting function that can be built into a dashboard. To understand the real difference between the two, we need to look at the following characteristics of each:
Alerting |
Anomaly Detection |
|
Goal |
Notifies users or systems when predefined conditions are met, which are derived from known events in the past | Identifies unusual patterns or outliers in data that do not conform to expected behavior |
Detection Method |
Rule-based, using straightforward comparisons against thresholds | Complex statistical or machine learning models to find deviations from normal behavior |
Operational Complexity |
Simple to set up with clear, straightforward rules | Requires data modeling and understanding of statistical techniques; can adapt to changes in data patterns over time, potentially offering more flexibility in identifying unforeseen issues |
Consider the example below of parametric alerting that shows upper and lower bounds (left), compared to statistical anomaly detection based on actual past results (right) against the same data plot. Parametric alerting triggers an alert based on simply falling above or below threshold values. With statistical anomaly detection, an alert only triggers if a data point falls outside of expected trends.

Other than predefined conditions, anomaly detection also differs from the way a user deals with the anomaly itself compared to an alert set to monitor known issues and conditions. Basic alerts are usually mapped to specific actions where anyone can look at the alert and will know what needs to be done. Anomaly detection is different in that it requires a deeper analysis to understand the Why. And that's where root cause analysis (RCA) becomes critical.
The extra step: root cause analysis (RCA)
But what happens after a business discovers an anomaly? Once an issue is identified, businesses need to understand why it happened to solve this specific issue and also prevent future occurrences. That's where root cause analysis (RCA) comes in. RCA is like a detective that comes in after the anomaly detection tool has found something amiss. RCA digs deep into the data to find out why the anomaly occurred, whether it's a flaw in the system, an external factor, or something else entirely.

This step is crucial, because knowing what went wrong helps prevent the same issue from happening again. While anomaly detection is fully automated with sophisticated algorithms at play, this step also brings the “human in the loop” to augment the analysis by bringing the business analysts into the process.
The impact of anomaly detection and root cause analysis
For businesses, the move to anomaly detection and Root Cause Analysis means they can be more agile and responsive. They can detect and address issues faster, improve customer satisfaction, and make more informed decisions. For you and me, it means the products and services we use every day can improve faster. It also means that companies will understand our needs better and can adjust what they offer to make sure we're getting the best experience possible.
As we move forward, the role of data in business is only going to get bigger. Anomaly detection and RCA are just the beginning. With advances in artificial intelligence and machine learning, these systems will become even smarter, more intuitive, and more capable of handling complex tasks.
This evolution will further marginalize traditional dashboards, transforming them from a primary tool for decision-making to a supplementary one, used for historical analysis rather than real-time insight. Real-time dashboards, enhanced with RCA, and even AI/ML, will take their place.
StarTree ThirdEye: Anomaly detection and RCA powered by Apache Pinot
StarTree ThirdEye is an all-in-one anomaly detection, monitoring, and root cause analysis tool that helps enterprises make the transition from the world of traditional dashboards to the AI-powered world of proactive and predictive analytics.
If your data is already in Apache Pinot, then using ThirdEye is a no-brainer. ThirdEye can:
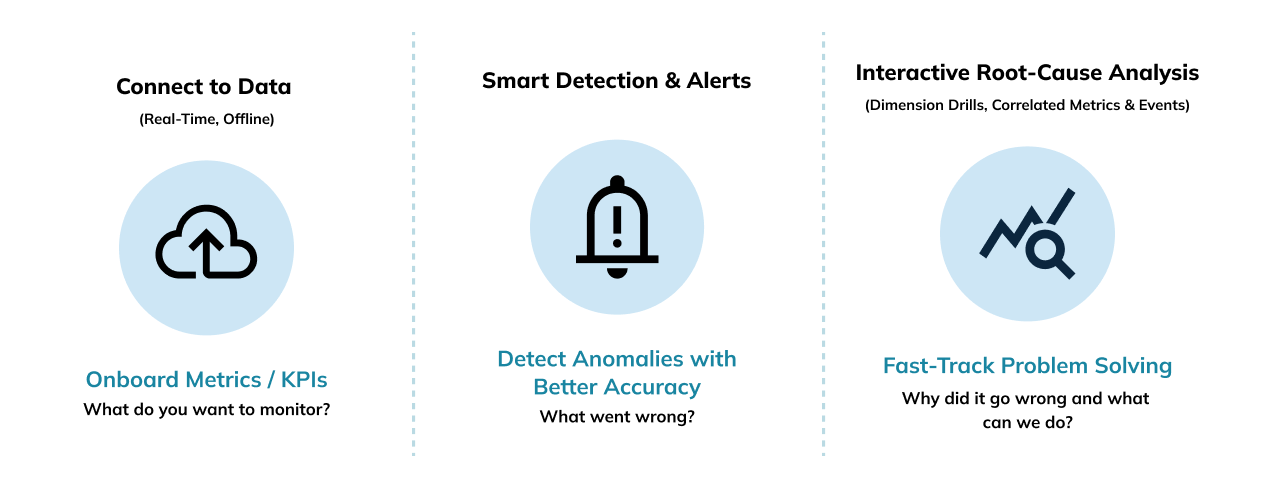
Monitor any dataset in Pinot
Detect anomalies with better accuracy
Fix issues fast with interactive RCA

Our customers span many industries, from retail to logistics to financial services — all leveraging ThirdEye to monitor key business metrics in real-time and instantly find out the root cause of any data anomalies.
For those not familiar with Apache Pinot, it is a real-time analytics platform designed for user-facing applications. Apache Pinot has been designed for scale and performance with best-in-class indexing strategies and smart data layout techniques used to boost query performance, and provide best-in-class price performance for user facing applications. Originally created at Linkedin, Apache Pinot is used by companies such as Uber, Doordash, Stripe, and others who have built applications on Pinot that require extremely high QPS and very low latency. Pinot has great support for ingesting data from real-time and batch data sources, and is the only system that can support upserts in real-time.
Conclusion
The shift from traditional dashboards to anomaly detection and root cause analysis (RCA) marks a pivotal change in data analytics, heralding an era that prioritizes speed, precision, and adaptability. This evolution doesn't just alter business operations; it fundamentally enhances the consumer experience, promising more reliable, personalized, and innovative services. The rapid identification of data anomalies enables businesses to not only swiftly address issues but also uncover opportunities for innovation, potentially redefining industries.
However, embracing this new era requires businesses to invest in advanced technology and skilled personnel, while carefully navigating ethical considerations around real-time data analysis to ensure privacy, security, and fairness. As data's role in our lives and businesses expands, the move away from dashboards towards a more dynamic and intelligent approach to analytics underscores a broader shift towards data-driven decision-making.
This transition is not merely a technological upgrade but a comprehensive transformation in how we perceive and respond to data, offering a future where businesses are not just guided by data but revolutionized by it. The end of dashboards signifies the beginning of an exciting journey into a future where data analytics empowers businesses to act with unprecedented speed and insight, unlocking new possibilities for growth and innovation.
Request a demo to see ThirdEye in action. If you’re interested in fully managed Apache Pinot, sign up for our free trial of StarTree Cloud to start querying in minutes.
Industry InsightsStarTree ThirdEye