
Read How to Pick Your Real-Time OLAP Platform part 2
Real-time analytics has transformed the way companies do business. It has unlocked the ability to make real-time decisions such as customer incentives, fraud detection, and operational intelligence. It also helps companies provide a personalized user experience which accelerates growth and improves retention. This is a complex problem and naturally, there are several OLAP (OnLine Analytics Processing) solutions out there, each focusing on a different aspect. In this blog, we attempt to understand the key aspects of real-time analytics and formalize the specific set of requirements for the underlying OLAP platform.
An ideal OLAP platform needs to be able to ingest data from a wide variety of sources as shown in the diagram. This data is then made available for querying across a wide spectrum of use cases. Each such use case and corresponding ingestion method has unique requirements on the underlying platform which can often be competing in nature. For example, a real-time metrics use case requires higher data accuracy at the expense of performance. On the other hand, a user-facing analytical application will need to be optimized for speed.
In this part 1 of the blog series, we will enumerate the specific requirements stemming from the use cases and data sources that must be met by an ideal OLAP platform. Part 2 will focus on Apache Pinot as a fit for this platform.
Use Case Requirements
There are several categories of use cases when it comes to real-time analytics. Here’s a quick summary of the requirements on the important categories:
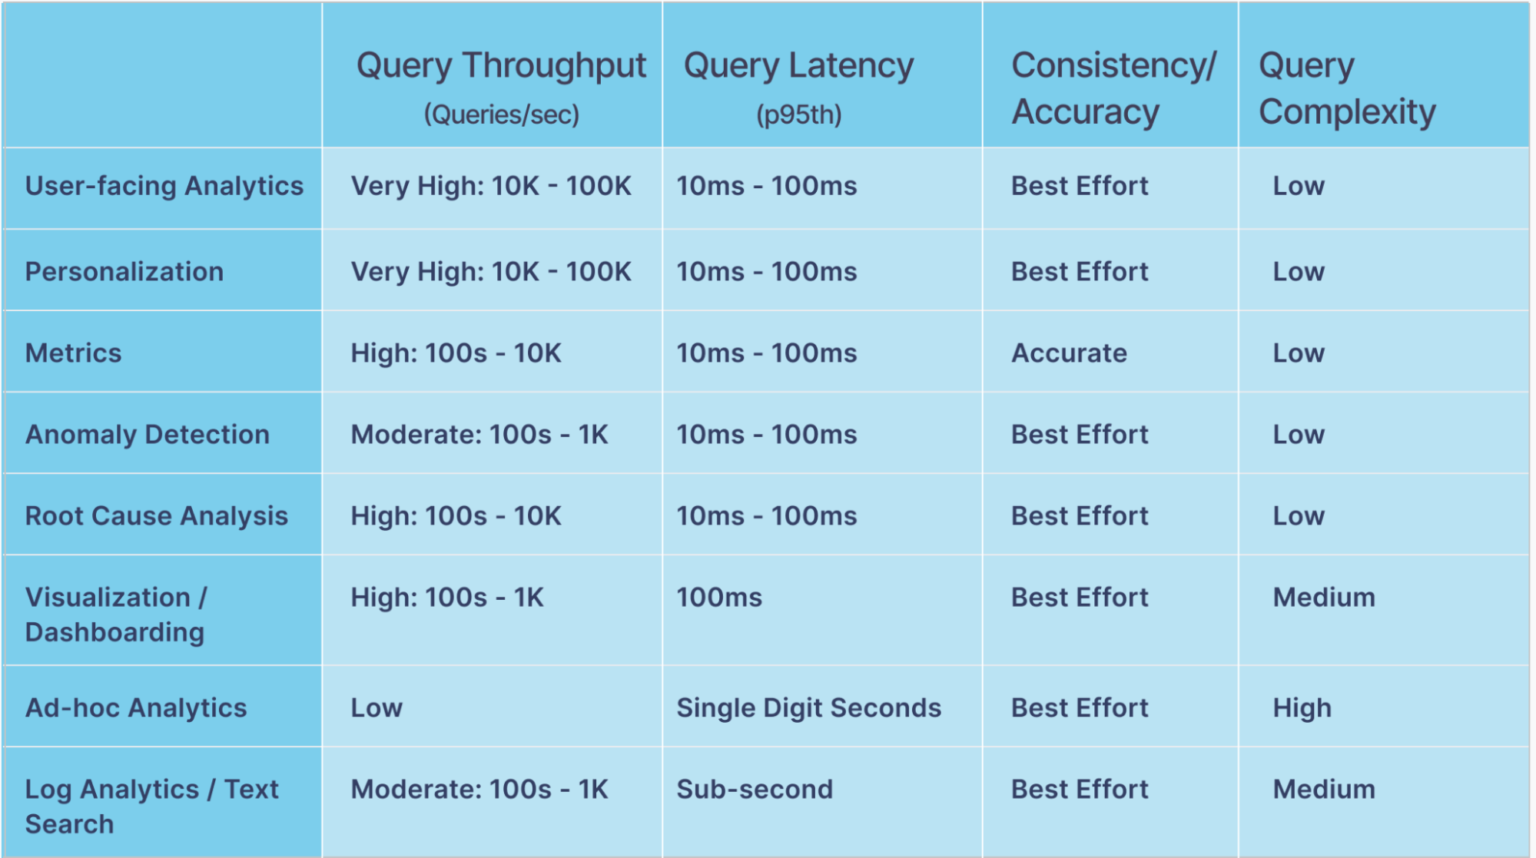
Let’s look at each category in greater detail.
User Facing Analytics
This is a category of use cases where the analytical capabilities are exposed directly to the customer or end-user to provide a personalized experience. For instance, LinkedIn users can access viewer insights for their posts, and Uber restaurant managers can look at sales, inventory, and order insights for their restaurant in real-time. The key requirements, in this case, are high throughput and low query latency since this directly impacts the user experience. In LinkedIn’s case, such use cases can easily generate 10s of thousands of QPS with a 100ms p99th query latency SLA. This is a critical use case for any business since query latency SLA violations can negatively impact revenue. For more information, please refer to this blog.
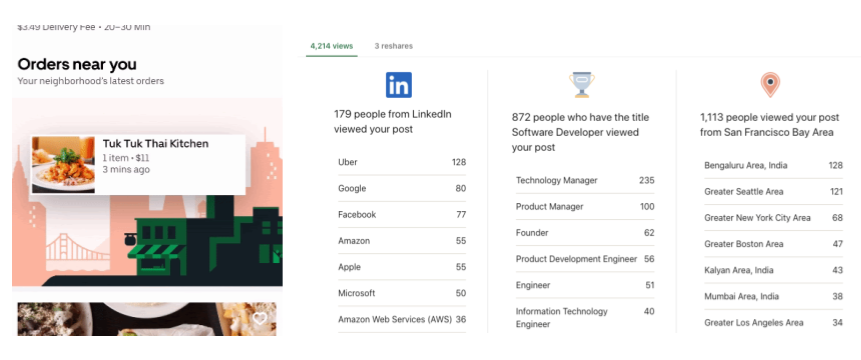
Fig: ‘Orders Near You’ (Image credits: https://eng.uber.com/orders-near-you) and LinkedIn Post Analytics – User Facing Applications
Personalization
This is a special type of user-facing analytics used to personalize the product experience for a given user. The key requirement here is to be able to extract real-time features based on the user’s activity and product interaction which are then used to generate personalized recommendations or actions. For instance, financial incentives for Uber drivers can be personalized based on individual needs. Similarly, the LinkedIn news feed is customized to match the interests of each member as shown below. Like user-facing analytics, the QPS and latency SLA requirements in this case are quite stringent.
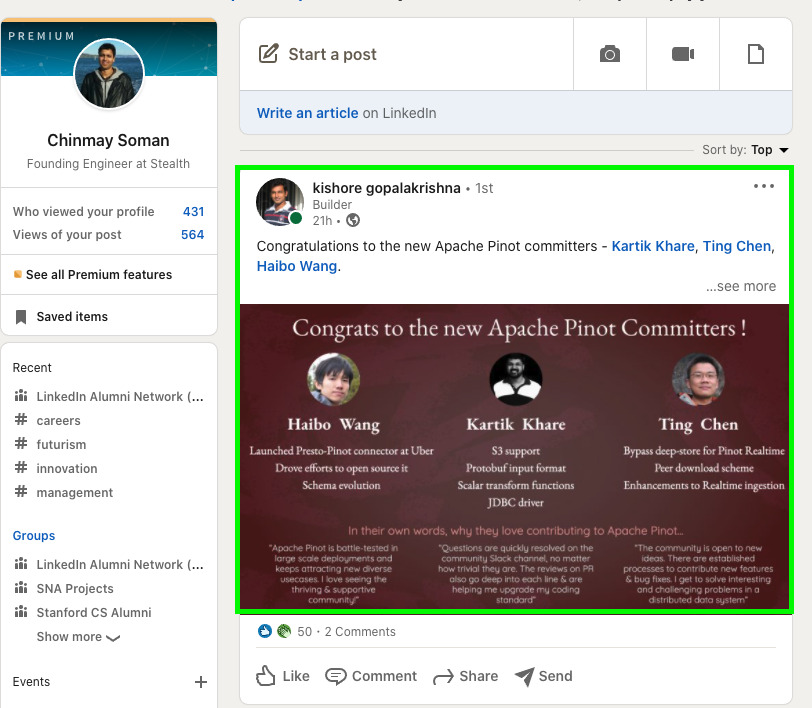
Fig: Personalized news feed on LinkedIn
Metrics
Tracking business metrics in real-time is critical for operational intelligence, anomaly/fraud detection, financial planning, and more. For example, tracking ‘pageViews’ is extremely important for LinkedIn to detect issues in real-time. Similarly, tracking demand-supply ratios or earnings per region enables Uber’s operational teams to maintain the health of the Uber network. This use case also requires the OLAP platform to support high QPS, low latency queries. In addition, a lot of cases require a high degree of data accuracy. This means the OLAP platform must be able to handle duplicates or upserts in the data sources.
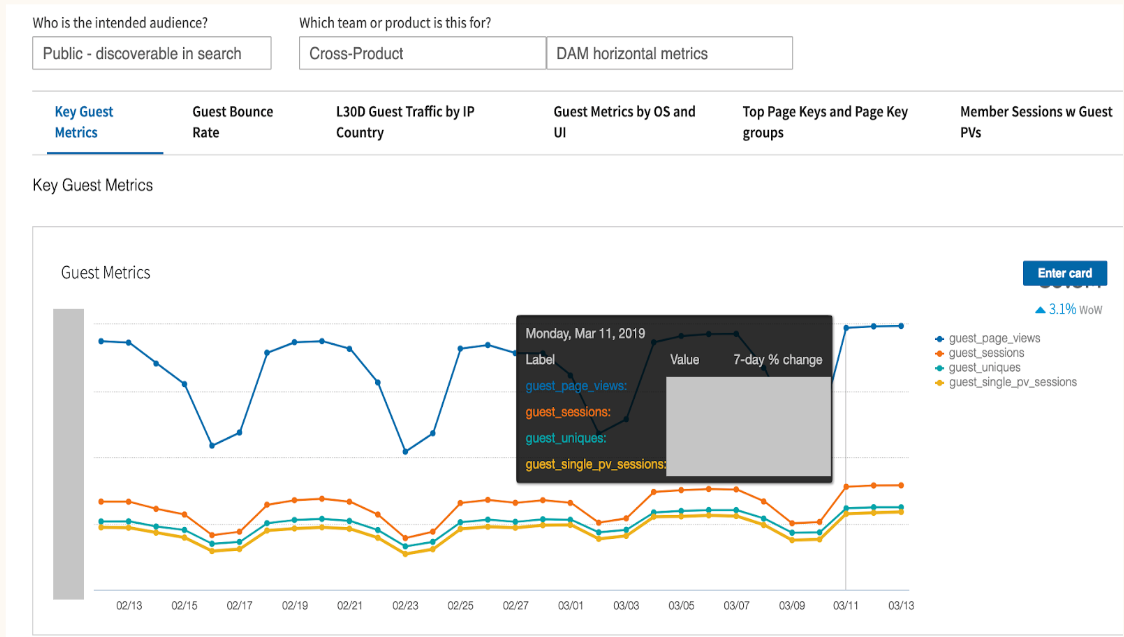
Fig: Metrics defined for a LinkedIn use case
Anomaly Detection and Root Cause Analysis
In addition to monitoring metrics, it is equally important to be able to detect anomalies on large time-series datasets instantly to perform appropriate actions in time. The figure below shows a drop in ‘pageViews’ metric based on week over week statistics which is marked as an anomaly. Subsequently, it’s important to understand which dimensions were primarily responsible for causing the anomaly – shown in the next figure. Both of these use cases require the ability to perform high QPS temporal scans and ‘group by’ queries on the OLAP platform.

Fig: PageViews Anomaly Detection & Root Cause Analysis (Image Credits: https://engineering.linkedin.com/blog/2019/01/introducing-thirdeye–linkedins-business-wide-monitoring-platform)
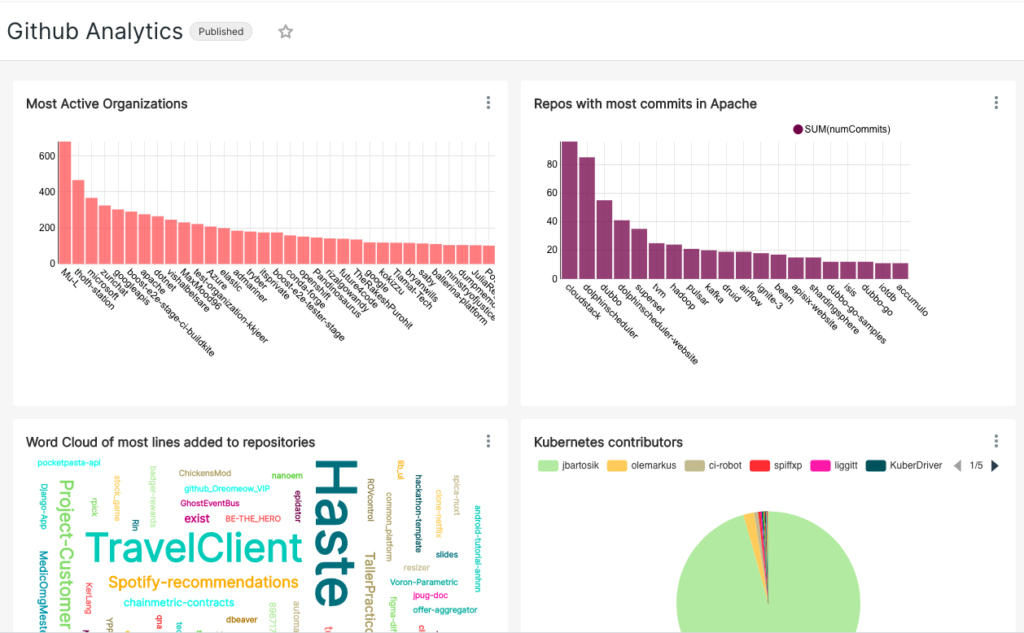
Visualization
This is one of the most common use cases for visually presenting insights obtained from an OLAP platform. Visualization can be as simple as a dashboard to plot metrics on different kinds of charts or as complex as geospatial visualization, clustering, trend analysis, and so on. Typically this requires the OLAP platform to integrate well with the existing visualization solutions such as Apache Superset and Grafana. Shown below is a Github analytics dashboard built using Apache Superset for analyzing Github merge events in real-time.
Ad Hoc Analytics
Oftentimes, users want to do real-time data exploration for debugging issues and detecting patterns as the events are being generated. For example, data scientists in Uber may want to identify delayed UberEats orders in the last 5 minutes or so or join real-time events with other offline data sets. This requires a way to support SQL (ANSI SQL compatible) queries on the underlying OLAP platform. Usually, the QPS is very low but the query complexity is high. This is a challenge since most of the common OLAP technologies don’t support ANSI SQL out of the box.
Log Analytics / Text Search
The ability to perform text search queries on application log data in real-time is a less common but important and challenging use case. Such logs can be enormous and often unstructured (eg: JSON format) which adds to the complexity. Ability to do regex style text search on logs in real-time is vital for triaging production issues. In addition, some applications will need the ability to do aggregation queries with text search predicates as part of their core business logic. The QPS is usually low for debugging use cases but can be high for user-facing applications.

Fig: User Facing text search application in LinkedIn. Ref: https://engineering.linkedin.com/blog/2021/text-analytics-on-linkedin-talent-insights-using-apache-pinot
Data Source Requirements
As shown in the diagram in the introduction, the different data sources can be categorized as:
- Streaming
- Batch/Offline
- OLTP systems
The common requirements imposed by all such sources are as follows:
- Unstructured Data : Data can either be structured or unstructured (eg: free form JSON data). The lack of a good structure makes it difficult to organize the data efficiently in most systems, thus increasing the processing overhead. On the other hand, the ability to handle unstructured data is very important for ease of adoption across a broad spectrum of users. A common approach is to rely on external systems to convert such datasets to a structured format (eg: flattening) before ingesting them into the OLAP platform. This is a bit of an overkill and in addition, increases the operational complexity of such data pipelines. Ideally, the underlying OLAP platform should be able to handle such unstructured datasets without significant degradation in query performance.
- High throughput : The OLAP platform must be able to keep up with the high rate of messages being produced across the different sources. This can easily range from a few MBs of data per day to TBs per day for larger use cases.
- Data transformation support : The underlying OLAP platform must support basic transformations on the incoming records. This can include projection, filtering, column transforms (eg: string manipulation, numerical processing, UDFs), and so on. Similar to the case of unstructured data, this also is necessary for ease of use and widespread adoption. Note: this is different from data enrichment which deals with joins and event decoration amongst other things.
- Upserts : As mentioned before, the ability to upsert data based on a primary key is crucial for certain use cases such as metrics. This can either be a full row upsert or partial (column subset) upsert. Without this capability, the resulting analytical queries will end up double-counting records or compute incorrect aggregations.
Now, let’s look at the unique requirements for each such data source.
Streaming Source Requirements
In a streaming data source, data is produced and consumed in a streaming fashion, in an asynchronous manner. Common examples of such sources include Apache Kafka, Apache Pulsar, Amazon Kinesis, Google PubSub. This is extremely useful for capturing system and application logs as well as business events produced by different microservices. In addition to the common requirements, streaming sources also need:
- Low ingestion latency : Ingestion latency refers to the amount of time between data being produced and available for querying. Ideally, this should be sub-second.
Batch (Offline) Source Requirements
Batch sources consist of files or objects stored in a traditional storage system like Apache HDFS, Amazon S3, Google GCS, and so on. This is typically used for bootstrapping a real-time analytics table with historical data, backfilling, and in scenarios where the raw data is not available in any real-time source (eg: output of an ETL pipeline). The unique requirements in this case are:
- Efficiency : We must be able to ingest all the data efficiently without compromising the SLA guarantees of the OLAP platform.
- Scheduling : Given that we will need to ingest the data multiple times (eg: daily jobs) the OLAP platform should support scheduling ingestion tasks periodically.
Note: Upserts are not applicable to batch sources. It is assumed that duplicates or updates are handled before ingesting them in the OLAP platform.
OLTP Source Requirements
Oftentimes, we want to be able to analyze all the data being stored in a traditional OLTP (OnLine Transaction Processing) database like MySQL or Postgres. Data ingestion in this case is typically done in 2 modes:
- Bootstrap : Fetch historical data from such data sources in a batch fashion. This is similar to batch/offline data source ingestion and follows the same requirements.
- Real-time updates : We should also be able to ingest the changes happening to the source in real-time. This is typically done by consuming the ‘Change Data Capture’ stream from such data sources. This stream represents a running log of all the updates happening at the source which can be replayed/upserted within the OLAP platform. Naturally, this mode follows the same requirements as a streaming data source.
Conclusion
Real-Time Analytics is a highly complex problem space. As we saw in this blog, there is a huge variation in the requirements imposed by the different use cases. At the same time, the need to ingest data from a variety of sources and formats further complicates the design of the OLAP platform to handle speed, flexibility as well as efficiency. It is indeed possible to pick different technologies and build customized solutions for each such use case. However, this comes at a big cost of development and operational overhead.
In part 2 of this blog series, we’ll understand how Apache Pinot addresses all of the above requirements.