Some of the most common questions we get asked are about the origins of Apache Pinot. Why did we create it? What was the need? What other systems did we try first? How was Apache Pinot uniquely able to solve the problems we faced?
That story starts at LinkedIn, where Apache Pinot was first developed, starting in 2014. Seeing what issues LinkedIn was solving will put some perspective on these sort of “why” questions—and suggest how the analytics landscape is going to change and grow this decade.
To give an idea of the shape of this history: Pinot is a study in solving an old problem in a new way, by getting back to basics. Consider: Walking, riding a horse, and traveling in a car or an airplane, all solve the age-old problem: “How do I get from here to there more quickly?” But none of these solutions came around by making small improvements on the last solution. As Henry Ford was famous for saying, “If I asked people what they wanted, they would all say faster horses.”
The story of Pinot at LinkedIn is the story of the realization that we needed something more than faster horses. Yes, we were solving issues of speed of data ingestion and query response latencies but this was at an unprecedented scale. We needed a fresh approach to tackle the problems, and once we did, it opened up all sorts of new vistas for LinkedIn.
LinkedIn Strives to Bring More Value to its Users
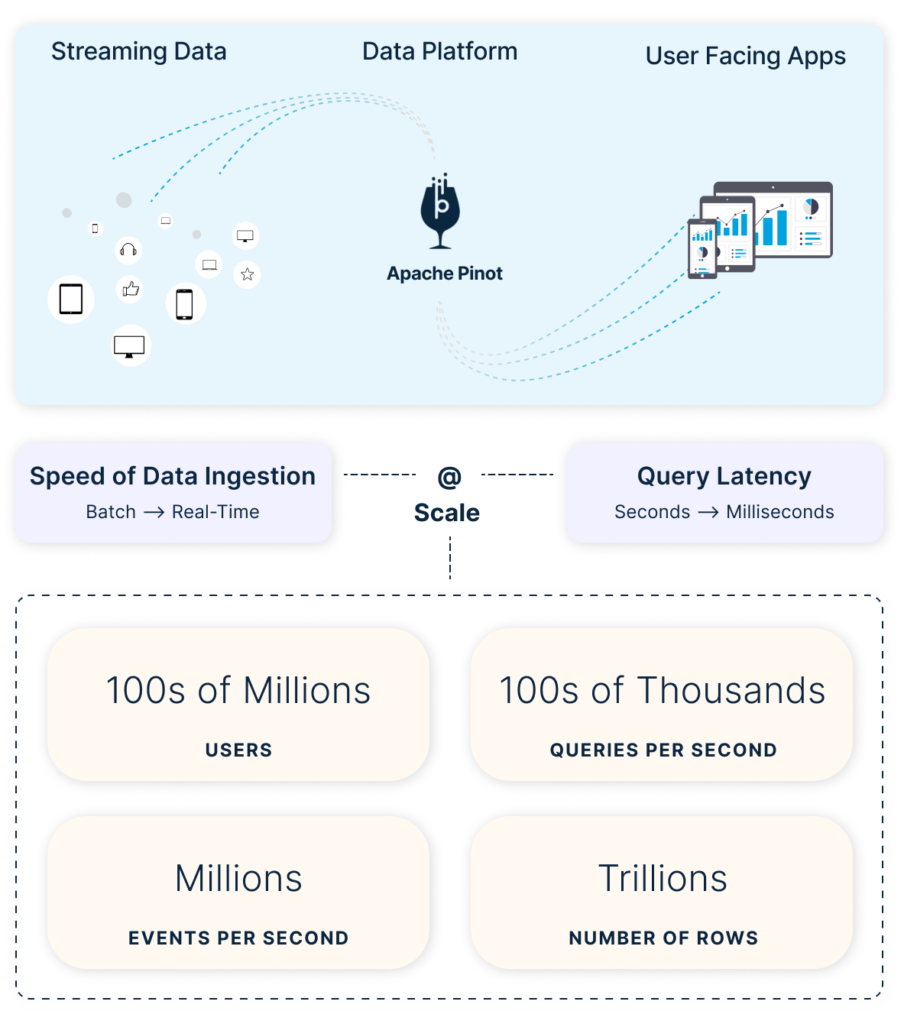
If you’ve used LinkedIn at all in the past few years, chances are good that you’ve used one of the services—whether that be article analytics, employee analytics, or talent insights. All of those and more use Pinot on the back end. Across the entirety of LinkedIn, there were 70+ products being built, many of which are user-facing and thus have very strict requirements when it comes to latency and throughput (the system has over 200,000+ queries per second!). Pinot is also the de facto system where all the business metrics are stored. That’s almost 10,000 business metrics, across which we see almost 50,000 plus dimensions.
We started work on Pinot in 2014. Our first use case was to meet the needs for the “Who’s viewed your profile” application at LinkedIn. To improve user experience and increase user engagement, the product team insisted that richer and fresh data be presented to users. Not 1 day or 1 hour fresh. Instantaneous access to every Linkedin user on who’s viewed their profile and a page refresh better grab the latest view by that recruiter across the globe.
To say “Who’s viewed your profile” was successful would be a massive understatement. It was electric. Everyone was visiting this new service. Engagement shot up to levels never before seen at LinkedIn. The product team went wild and immediately started dreaming about other similar features.
The Nightmares of Success
However, this success brought along challenges as the stack that was powering the analytics wasn’t designed for such usage. At the time, we had Kafka for data ingestion, and the data lived in Hadoop. These fed into Sensei and Bobo (which had Lucene as a basis).
With the success of the new application, we went from seeing hundreds of queries a second to over a thousand queries a second. So we expanded the cluster, growing it by hundreds of nodes just to maintain the SLA for our user-facing applications. Needless to say, we had issues managing such a large cluster. Our small team was in “code yellow” all the time. It became readily apparent that the cluster management systems at that time were not designed to handle such large deployments and the solution would not hold up at the exponential intersection of acquiring new users and product adding new features.
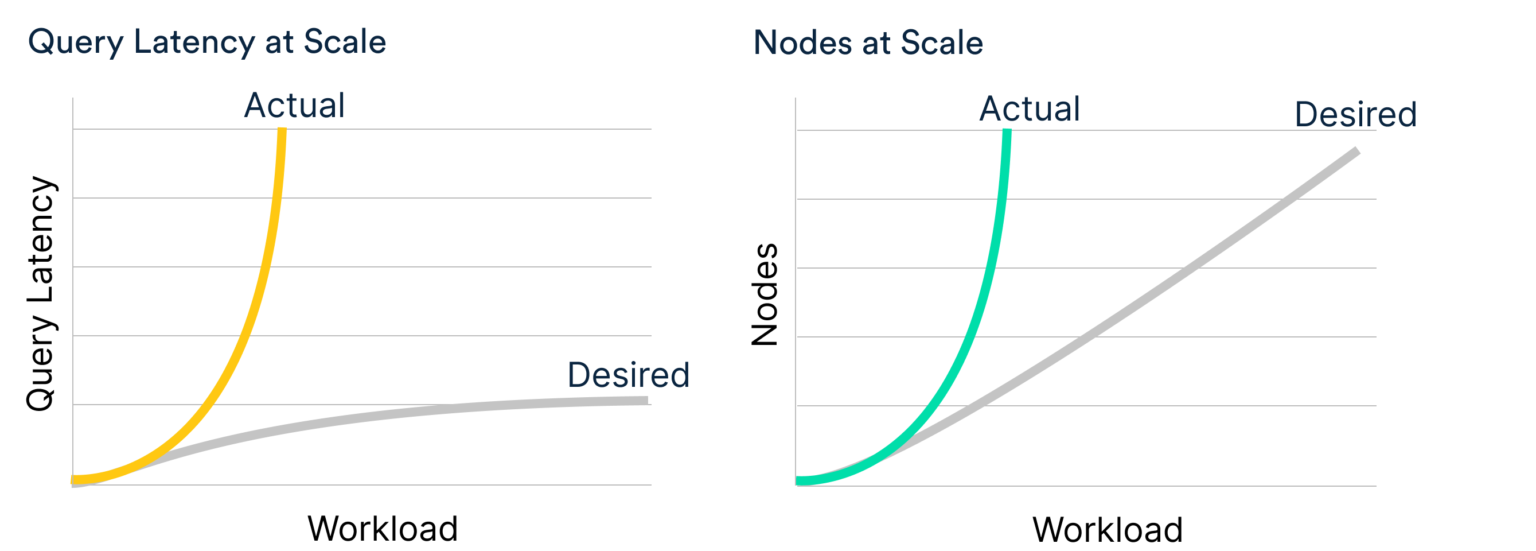
The search-based datastores we were using did not meet the requirements for serving analytical processing. Inverted index and fixed query plan systems (common in search-based datastores) don’t need to scan all the results and hence are not well-suited for queries that do aggregations. Moreover, as the number of queries can easily reach the 100k+ range, these systems experience an exponential latency curve. In short, the system was simply not made to scale effectively for user-facing analytics.
There was not a single thing that we had not tried to keep that cluster up and running. At one point, most of us just wanted to kill this product and go back to using the batch mode.
Scaling the wall of real-time user-facing analytics
I wish I could say that inspiration struck out of the blue, but most innovation does not work that way. It comes from working on the same problem for long hours and realizing that there is a different way to do things. The problem does not change, but our approach to it does: That’s why riding horseback became the main mode of travel rather than walking, and then automobiles became the mode replacing horseback, and so on with airplanes, and…you get the picture.
So we went back to the drawing board. We took a look at the search system first and realized that it was not made for analytics. For example, a search system only has to return its top results. It does not need to further scan them and aggregate them. The technologies we were using (Sensei which was based on Lucene) relied heavily on inverted indexes, which did not address all the issues of OLAP at the OLTP scale. And they had fixed query plans.
It became clear to us that we couldn’t use such systems that are tightly coupled together. We started to ask: What would happen if we broke this system down into simpler pieces and just re-assembled them on the fly?
Without going into too many details, what we did was just that, taking the most appropriate technologies for each phase (storage, filter, and post-filter). Storage, for example, could use a columnar store. For the filter stage, we could use a sorted index or star tree index. Post-filter, which was using a scan function, could use star-tree pre-aggregation instead.


It was not just this mix-and-match that helped, however. The true key to getting Pinot to work was its flexible query planning layer. What it means is that we can pick and choose what we want to use on a per-query basis by looking at the segment metadata and the query.
In less technical terms: We took an approach that was different from what was common in database management circles. Whereas a database engineer is inclined to ask the question “How can we accomplish this work faster?”, we started with a different question: How can we avoid doing this work, at each step, in the first place?
Going into Production
I will say that we had to build a lot of infrastructure to make this happen. There was testing, of course. We built a shadow cluster to run the new system side-by-side with the old one, updating both to validate the results. There was a lot of information moving to and from this shadow cluster. In the end, though, we were able to keep the system running smoothly and sustainably.
So how does the system look today?
At its height, the system had thousands of nodes, and thousands of queries a second coming from some 200 million members. Today, the system is running with just 75 nodes. It is serving up close to 5,000 queries per second for just the “Who’s viewed your profile” application, and LinkedIn is almost approaching 774+ million members. On top of that, the latency has been kept very low. No cache is involved; each time the application is used, it makes its own separate query to the system. But the latency is minimal, in the range of 84 to 136 milliseconds.
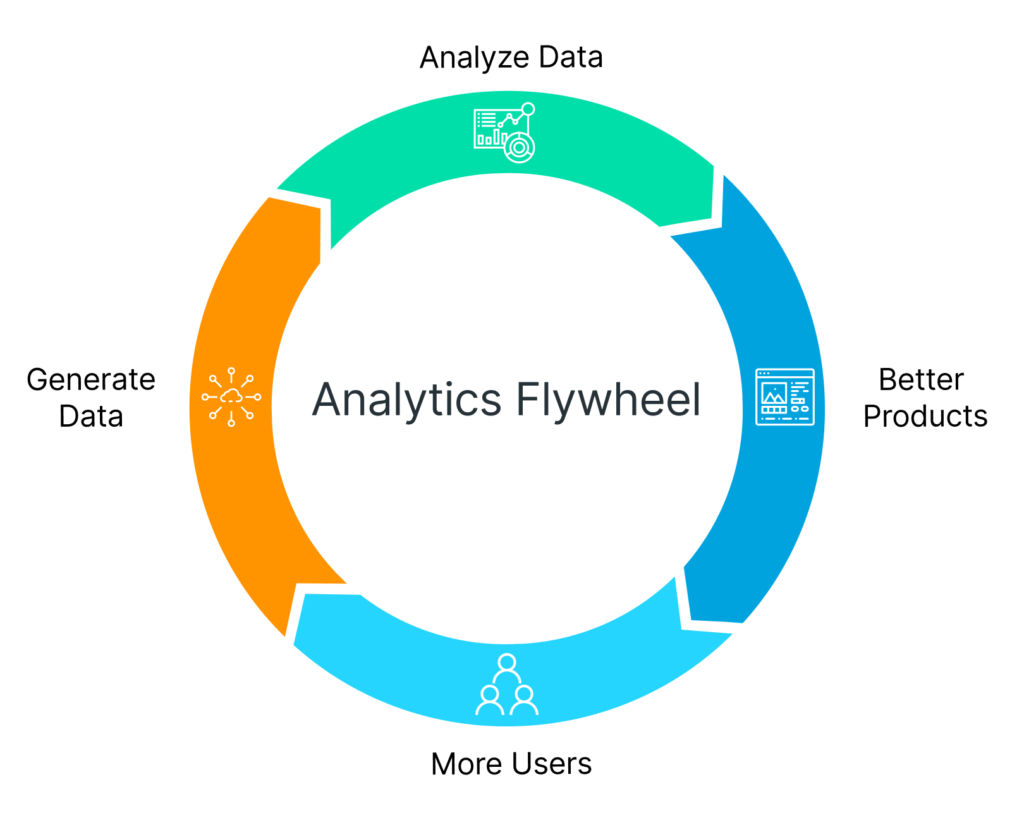
By removing issues of latency and scale, we opened up a new vista for LinkedIn’s product managers. Once they saw what Pinot could do with one application, it got their creative juices flowing. They were starting to ask: “What could other users do with all this available data? And how would that get them to use our platform more extensively?”
Going Beyond
For a while, Pinot was simply the technology at the core of our jobs at LinkedIn. We weren’t thinking, at first, about bringing this technology anywhere else, let alone building a whole community around it.
It wasn’t until our cofounder, Xiang Fu, moved to Uber and successfully introduced Pinot there that I began to see the bigger picture. I realized that user-facing analytics applications were an untapped opportunity for literally every organization, of any size. And Pinot, with its high speed of ingestion, low latency, and real-time updates, could be the key that would let them realize that opportunity and unleash the power of their data.
- Download page: https://pinot.apache.org/download/
- Getting started: https://docs.pinot.apache.org/getting-started
- Join our Slack channel: https://communityinviter.com/apps/apache-pinot/apache-pinot
- See our upcoming events: https://www.meetup.com/apache-pinot
- Follow us on Twitter: https://twitter.com/startreedata
- Subscribe to our YouTube channel: https://www.youtube.com/startreedata